5.8 KiB
SAS and PowerSAS.m: The Story
1. What are Semi-Analysical Solutions (SAS)?
Semi-analytical solutions (SAS) is a family of computational methods that uses certain analytical formulations (e.g., power series, fraction of power series, continued fractions) to approximate the solutions of mathematical problems. In terms of formulation, they are quite different from the commonly used numerical approaches e.g., Newton-Raphson method for solving algebraic equations, Runge-Kutta and Trapezoidal methods for solving differential equations. The parameters of SAS still need to be determined through some (easier and more robustness-guaranteed) numerical computation, and thus these methods are called semi-analytical.
2. What are the advantages of SAS?
In power system modeling and analysis, SAS has proven several features:
-
High numerical robustness. Steady-state analysis usually requires solving nonlinear algebraic equations. Traditional tools usually use Newton-Raphson method or its variants, whose results can be highly dependent on the selection of starting point and they suffer from non-convergence problem. In contrast, SAS provides much better convergence thanks to the high-level analytical nature.
-
Enhanced computational performance. In dynamic analysis, the traditional numerical integration approaches are essentially lower-order methods, which are confined to small time steps to avoid too-rapid error accumulation. These tiny time steps severely restrict the computation speed. In contrast, SAS provides high-order approximation, enabling much larger effective time steps and faster computation speed.
-
More accurate event-driven simulation. For complex system simulation, it is common to simulate discrete events. Traditional numerical integration methods only provide solution values on discrete time steps and thus may incur substantial errors predicting events. In contrast, SAS provides an analytical form of solution as a continuous function, and thus can significantly reduce event prediction errors.
3. How is the performance of PowerSAS.m?
3.1 Benchmarking with traditional methods on Matlab
PowerSAS.m shows advantages in both computational robustness and efficiency over the traditional approaches.
On steady-state analysis, we have done several benchmarking with traditional methods. For example, we test the steady-state contingency analysis on PowerSAS.m and Newton-Raphson (NR) method and its variants on Matlab. The test is performed on a reduced Eastern-Interconnection (EI) system and we tested on 30,000 contingency scenarios. The results suggest that the traditional methods have about 1% chance of failing to deliver correct results, while SAS has delivered all the correct results.
For more details, please refer to our recent paper:
- Rui Yao, Feng Qiu, Kai Sun, “Contingency Analysis Based on Partitioned and Parallel Holomorphic Embedding”, IEEE Transactions on Power Systems, in press.
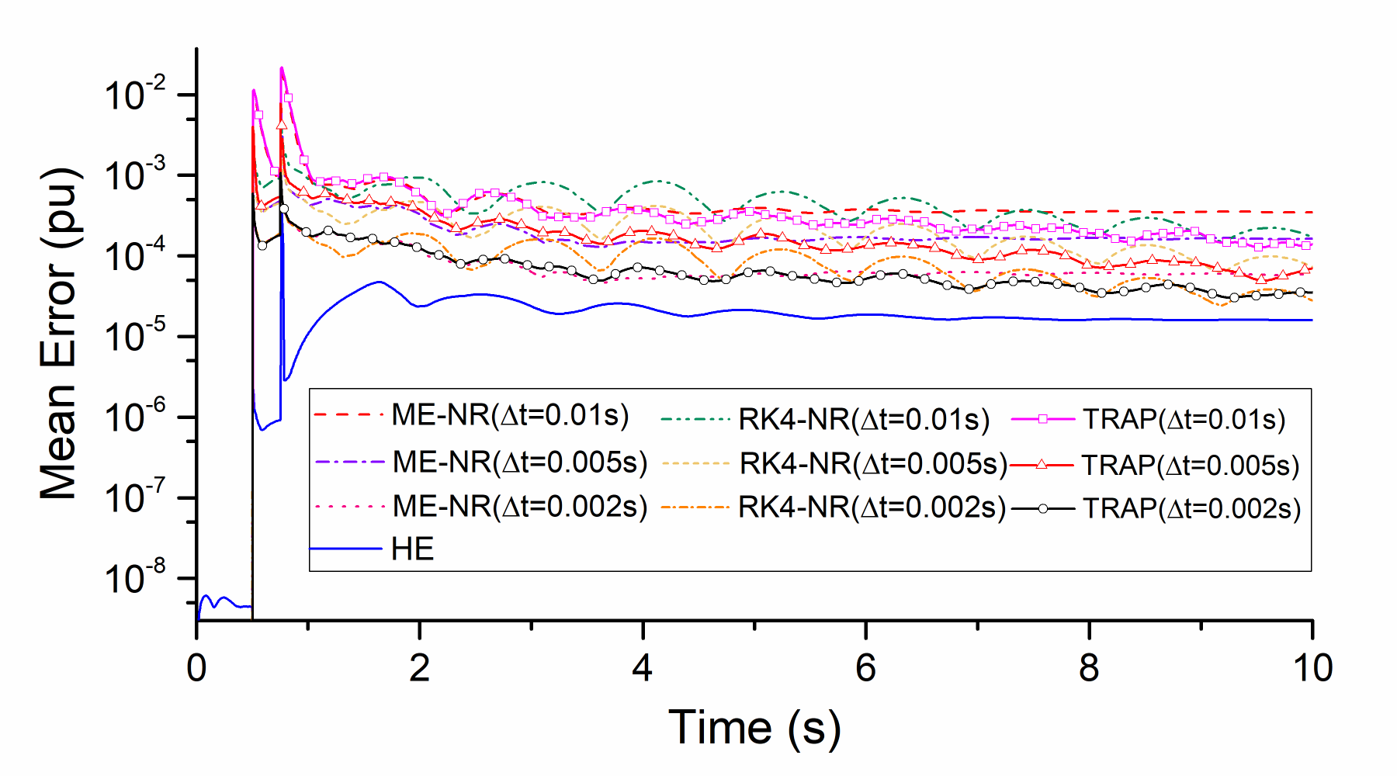
On dynamic analysis, we have compared with serveral most commonly used traditional numerical approaches for solving ODE/DAEs, including modified Euler, Runge-Kutta, and trapezoidal methods. Tests of transient-stability analysis on IEEE 39-bus system model and large-scale mdodified Polish 2383-bus system model have verified that SAS has significant advantages over the traditional methods in both accuracy and efficiency.
Accuracy comparison on IEEE 39-bus system (1) -- Comparison with fixed-time-step traditional methods
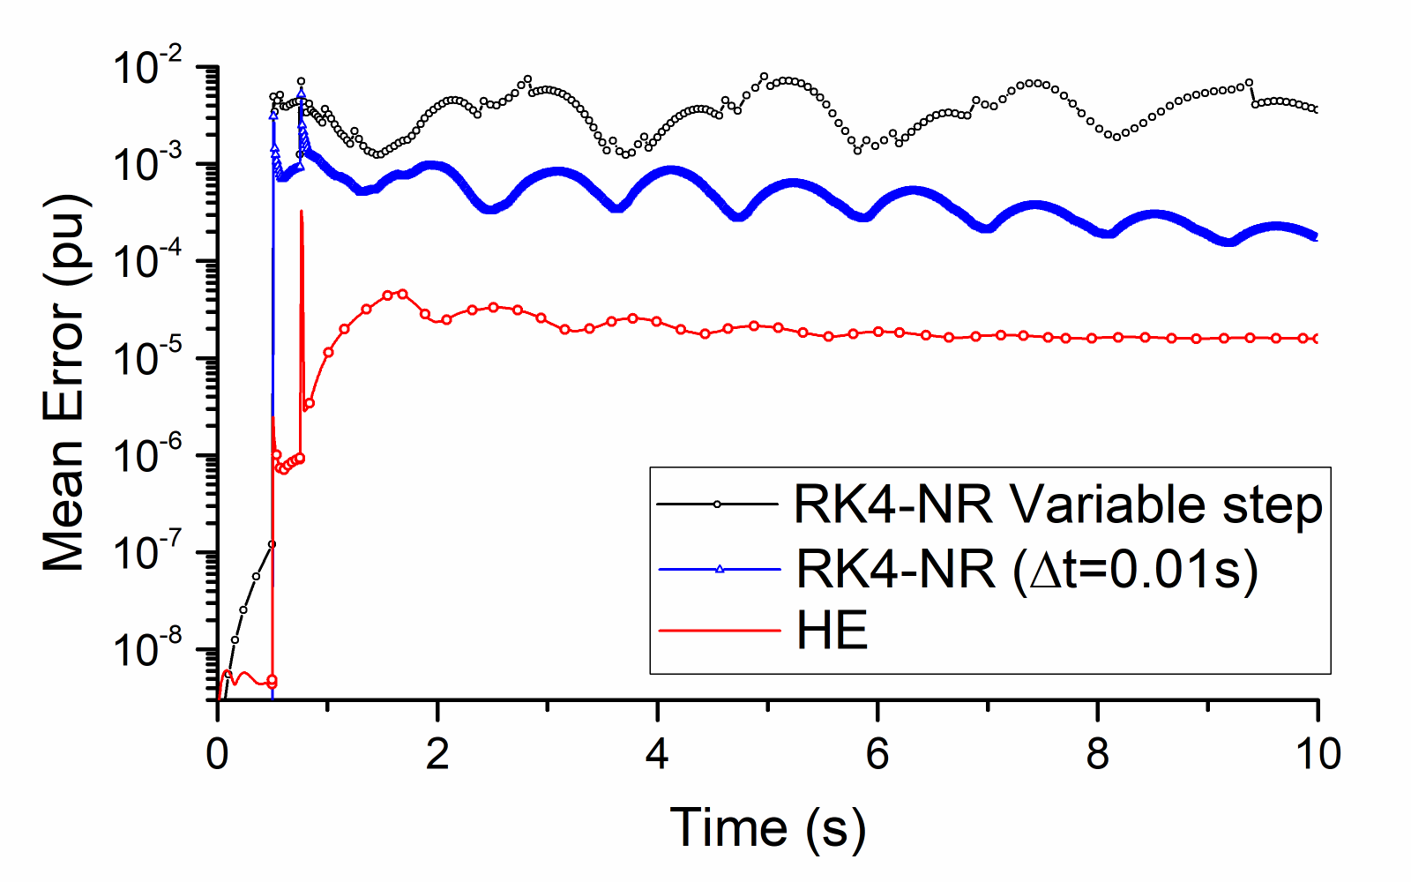
Accuracy comparison on IEEE 39-bus system (2) -- Comparison with variable-time-step traditional method
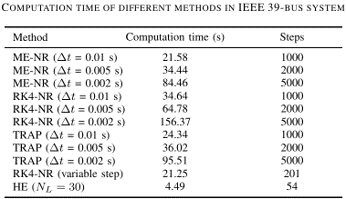
 Computation time comparison on IEEE 39-bus system
 For more details, please refer to our recent paper:
- Rui Yao, Yang Liu, Kai Sun, Feng Qiu, Jianhui Wang,"Efficient and Robust Dynamic Simulation of Power Systems with Holomorphic Embedding", IEEE Transactions on Power Systems, 35 (2), 938 - 949, 2020.
3.2 Benchmarking with PSS/E
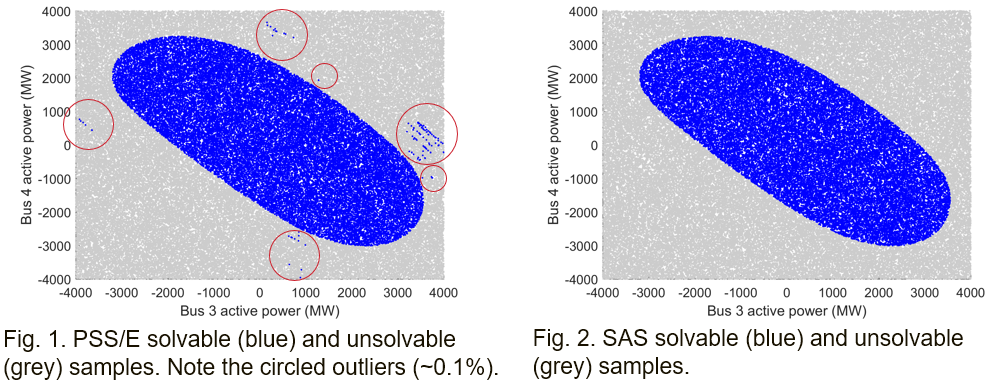
3.2.1 Static Security Region (SSR)
Static Security Region (SSR) is an important decision-support tool showing region of stable operating points. However, there are often challenges on convergence when computing SSRs, especially near the boundaries. So SSR can be used for benchmarking the numerical robustness of computational methods.
We test SSR on IEEE 39-bus system by varying active power of buses 3&4. The active power of buses 3&4 are sampled uniformly over the interval of [-4000, 4000] MW. The figure below shows the SSR derived by PSS/E and PowerSAS.m. It shows that PSS/E result have some irregular outliers (about 0.1% of the samples) outside of the SSR and actually are not correct solutions of power flow equations. In contrast, PowerSAS.m correctly identifies the SSR.
3.2.2 N-k Contingency analysis
Contingency ananlysis also has convergence challenges due to large disturbances. Here we perform benchmarking between PSS/E (with and without non-divergence options) and PowerSAS.m on the N-25 contingency analysis on a reduced eastern-interconnection (EI) system with 458 buses. We increase the load & generation level by 15%, 20%, and 20.7%, respectively, as 3 different loading scenarios (loading margin is 20.791%). In each scenario, we randomly choose 5000 N-25 contingency samples.
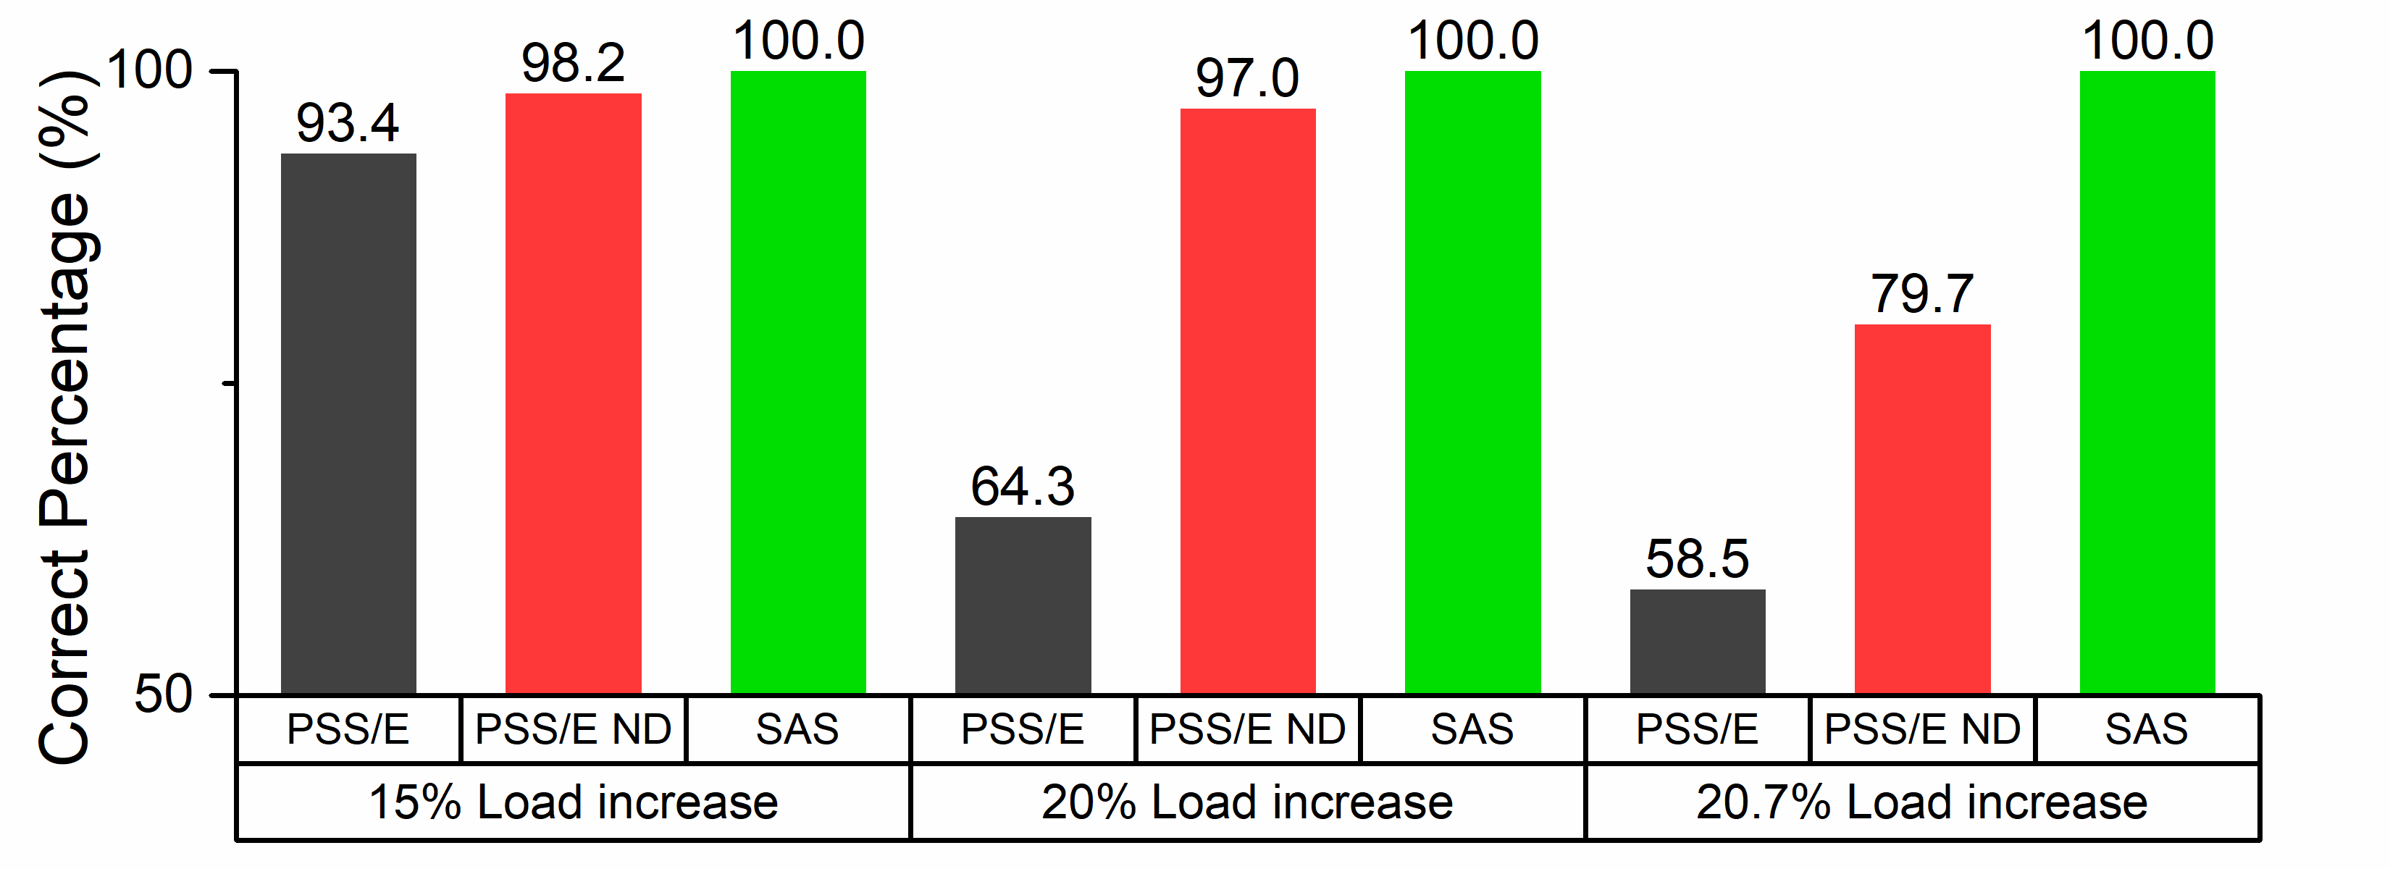
The figure shows the percentage of correct results using different tools. It can be seen that PSS/E has some chance to deliver incorrect results, and the chance increases with loading level. In contrast, PowerSAS.m still returns results all correctly.
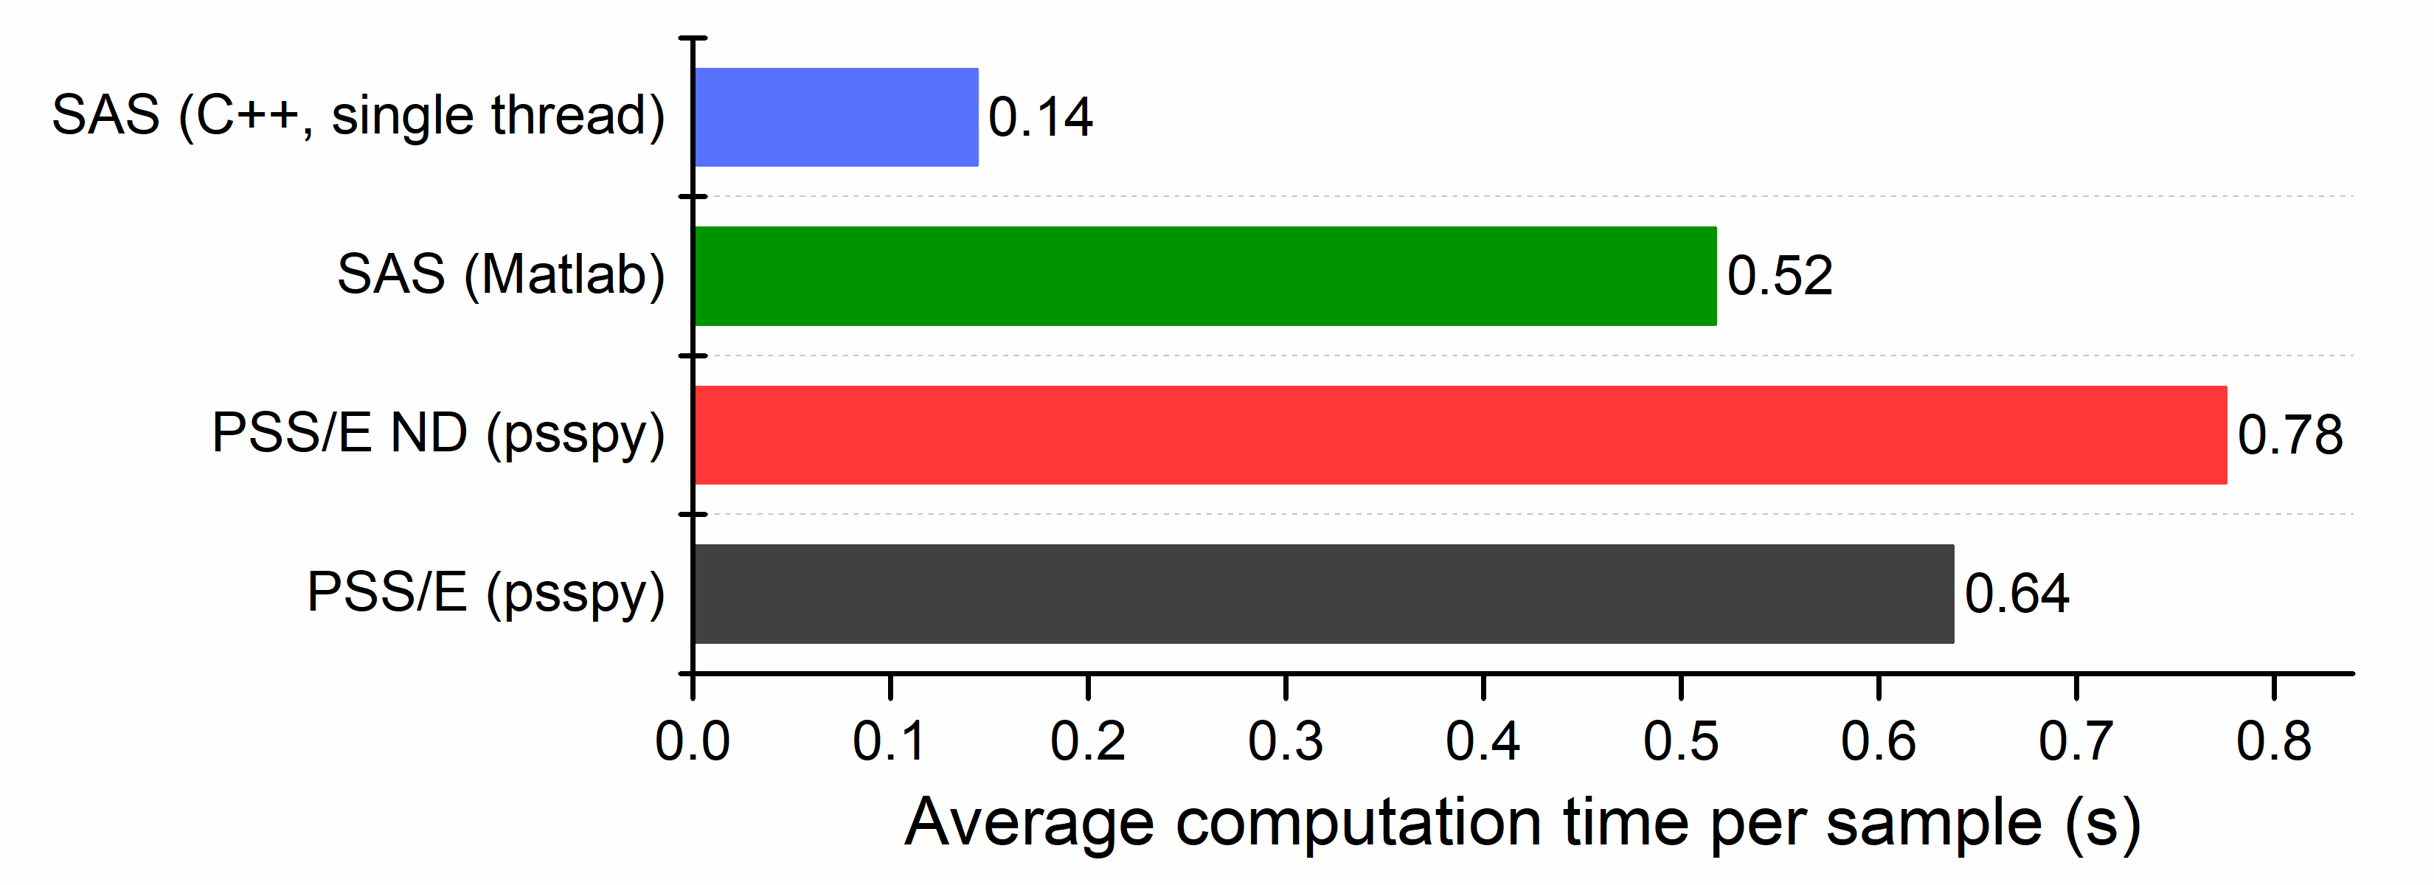
We also compared the computation speeds of PowerSAS.m and PSS/E. The figure below shows the average contingency analysis computation time of on the 458-bus system. The results show that SAS’s speed is comparable to and even faster than PSS/E’s.